I modified my Ising model simulation code a bit to capture the sizes of
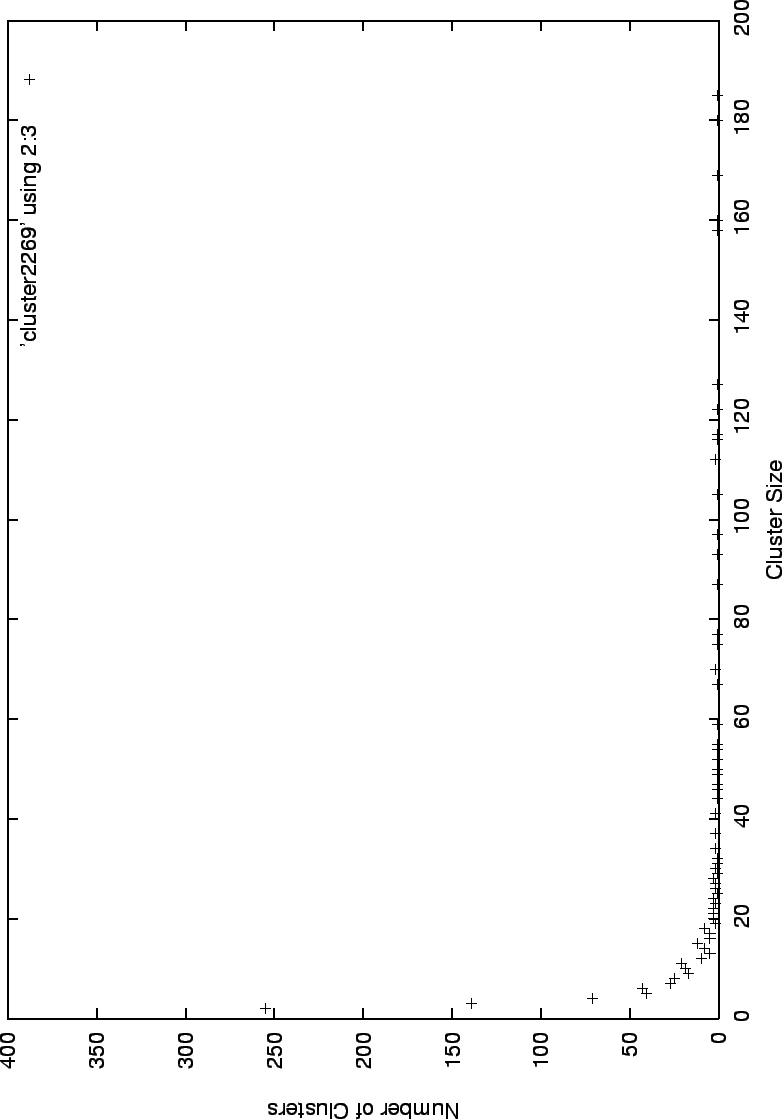
the clusters formed after 128 time steps. I found that at ![]() the distribution of cluster sizes is reminiscent of a power law in that
it has a very sharp curve (see Figure 32).
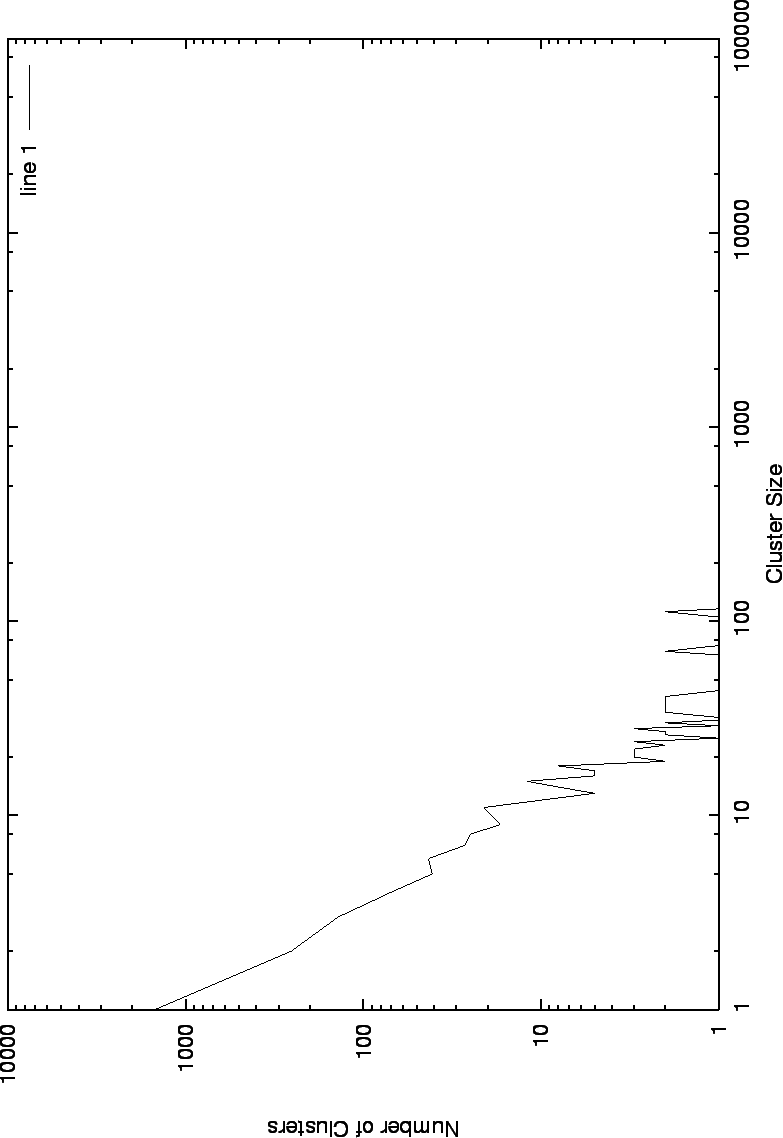
When plotted on a log-log plot (Figure 33),
the distribution appears to be ``linear''
(which indicates a power law distribution).
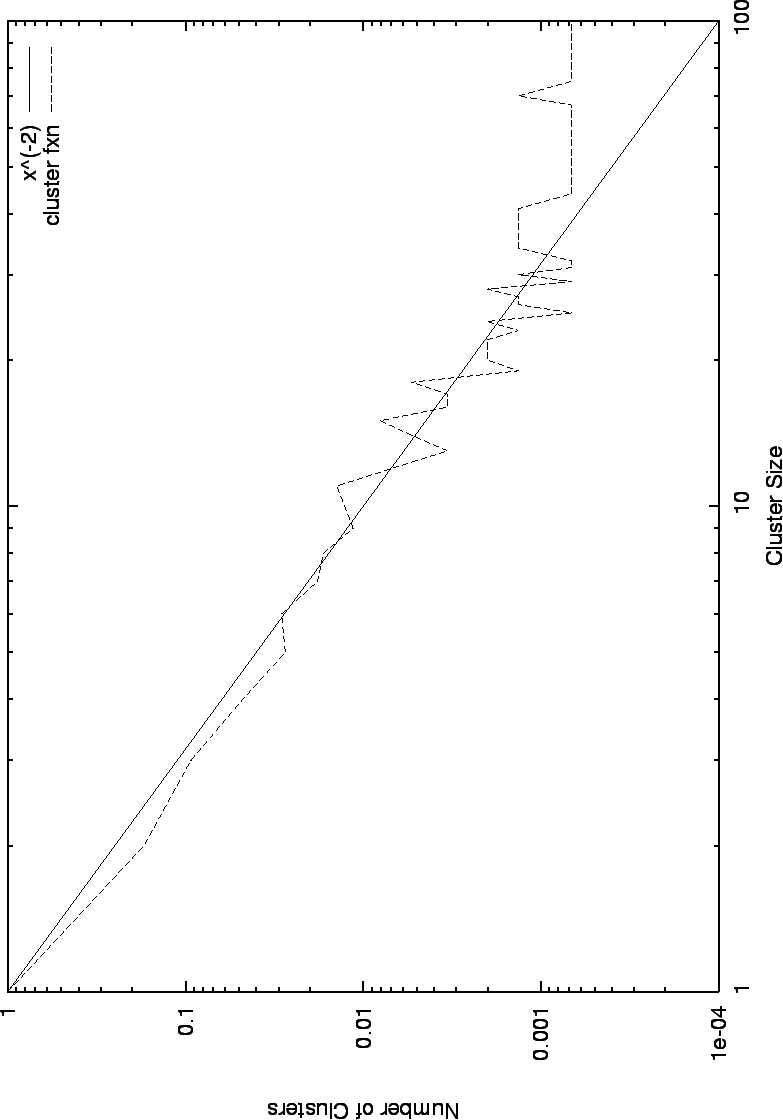
Figure 34 demonstrates the similarity between the cluster
distributions and the function
the distribution of cluster sizes is reminiscent of a power law in that
it has a very sharp curve (see Figure 32).
When plotted on a log-log plot (Figure 33),
the distribution appears to be ``linear''
(which indicates a power law distribution).
Figure 34 demonstrates the similarity between the cluster
distributions and the function ![]() .
.
 |