GP4IXM Data Analysis
Table of Contents
Data Analysis
tools
GP parameters
Collect results from the GP parameters run in ./raw/gp-params
# each instance holds the information from one run
class Result
  attr_accessor :s, :m, :b, :g, :raw
  def initialize(s, m, b, g)
    self.s = s; self.m = m; self.b = b; self.g = g
  end
  def counts
    self.raw.split("\n").
      map{|l| [Float($1), Float($2)] if l.match(/([\.\d]+)[ \t]([\.\d]+)/)}.compact
  end
  def runtime() self.counts.size end
  def average
    if self.runtime > 0
      self.counts.inject(0){ |sum, n| sum + n[1] } / self.runtime
    else
      -1
    end
  end
end

base = "./raw/gp-params/"
results = Dir.entries(base).map do |e|
  if e.match(/r_s.(\d+)_m.(\d+)_b.(\d+)_i.(\d+)_g.(\d+).(\d+)/)
    r = Result.new($1, $2, $3, Float("#{$5}.#{$6}"))
    r.raw = File.read(File.join(base, e))
    r
  end
end.compact
# <<gp-params_results_setup>>
# print out averaged over 5 goal runs
puts "|sharing|mutation|breeding|goal|runtime|average fitness|"
puts "|--------"
runtime = 0; average = 0
results.each do |r|
  goal_num  = r.g.to_s.split(".")[0]
  goal_time = r.g.to_s.split(".")[1]
  runtime  += r.runtime
  average  += r.average
  if goal_time == "4"
    runtime = runtime / 5
    average = average / 5
    puts "|"+[:s, :m, :b].map{ |meth| r.send(meth).to_s}.join("|")+
      "|#{goal_num}|#{runtime}|#{average}|"
    runtime = 0
    average = 0
  end
end
gp-param results in tabular form
| sharing | mutation | breeding | goal | runtime | average fitness |
|---|---|---|---|---|---|
| 0 | 10 | 10 | 0 | 9 | 4049.28409090909 |
| 0 | 10 | 100 | 0 | 14 | 2060.36547619048 |
| 0 | 100 | 100 | 0 | 101 | 2529.54963621051 |
| 0 | 100 | 10 | 0 | 132 | 2909.66486823494 |
| 0 | 10 | 10 | 1 | 42 | 266.851231300345 |
| 0 | 100 | 10 | 1 | 141 | 139.570506458541 |
| 0 | 10 | 100 | 1 | 264 | 99.7771832410837 |
| 0 | 100 | 100 | 1 | 303 | 270.617550373458 |
| goal | m.10 b.10 | m.10 b.100 | m.100 b.10 | m.100 b.100 |
|---|---|---|---|---|
| 1 | 9 | 14 | 132 | 101 |
| 2 | 42 | 264 | 141 | 303 |
generate graph of gp-param results (for some reason gnuplot SVG output only works gnuplot is called twice)
set boxwidth 0.9 relative
set title 'run times by GP params'
set xlabel 'problems'
set xtics ("xxx**xxxx***+" 0, "7xxx**+" 1)
set ylabel 'runtimes (seconds)'
set style data histograms
set style fill solid 1.0 border -1
plot data using 2 title 'm.10 b.10', '' using 3 title 'm.10 b.100', '' using 4 title 'm.100 b.10', '' using 5 title 'm.100 b.100'

sharing
# each instance holds the information from one run
class Result
  attr_accessor :s, :m, :b, :g, :raw
  def initialize(s, m, b, g)
    self.s = s; self.m = m; self.b = b; self.g = g
  end
  def counts
    self.raw.split("\n").
      map{|l| [Float($1), Float($2)] if l.match(/([\.\d]+)[ \t]([\.\d]+)/)}.compact
  end
  def runtime() self.counts.size end
  def average
    if self.runtime > 0
      self.counts.inject(0){ |sum, n| sum + n[1] } / self.runtime
    else
      -1
    end
  end
end

base = "./raw/sharing/"
results = Dir.entries(base).map do |e|
  if e.match(/r_s.(\d+)_m.(\d+)_b.(\d+)_g.(\d+).(\d+)/)
    r = Result.new($1, $2, $3, Float("#{$4}.#{$5}"))
    r.raw = File.read(File.join(base, e))
    r
  end
end.compact
# <<sharing_results_setup>>
# print out averaged over 5 goal runs
puts "|sharing|mutation|breeding|goal|runtime|average|"
puts "|--------"
runtime = 0; average = 0
results.each do |r|
  goal_num  = r.g.to_s.split(".")[0]
  goal_time = r.g.to_s.split(".")[1]
  runtime  += r.runtime
  average  += r.average
  if goal_time == "4"
    runtime = runtime / 5
    average = average / 5
    puts "|"+[:s, :m, :b].map{ |meth| r.send(meth).to_s}.join("|")+
      "|#{goal_num}|#{runtime}|#{average}|"
    runtime = 0
    average = 0
  end
end
| goal | sharing | mutation | breeding | runtime | average |
|---|---|---|---|---|---|
| 0 | 100 | 10 | 10 | 34 | 2131.9212962963 |
| 0 | 0 | 10 | 10 | 14 | 2790.12836363636 |
| 1 | 100 | 10 | 10 | 10 | 121.083356643357 |
| 1 | 0 | 10 | 10 | 17 | 300.862181818182 |
| goal | smb | -mb |
|---|---|---|
| 1 | 121.083356643357 | 300.862181818182 |
| 2 | 2131.9212962963 | 2790.12836363636 |
reset
set boxwidth 0.9 relative
set xlabel 'problems'
set xtics ("xxx**" 1, "xx*" 0)
set ylabel 'runtimes (seconds)'
set style data histograms
set style fill solid 1.0 border -1
plot data using 2 title 'smb', '' using 3 title '-mb'
ingest a directory of results into ruby
ingest a directories worth of run results and return a list of Datum
class Datum
  attr_accessor :share, :goal, :run, :time, :score, :path
end
def ingest(base)
  Dir.entries(base).map do |e|
    if (e.match(/r_s.(\d+)_m.(\d+)_b.(\d+)_i.(\d+)_g.(\d+).(\d+)/) or
        e.match(/r_S.(\d+)_s.\d+_m.(\d+)_b.(\d+)_i.(\d+)_g.(\d+).(\d+)/))
      share = Integer($1)
      goal  = Integer($5)
      run   = Integer($6)
      File.read(File.join(base, e)).map do |l|
        if l.match(/^([\d\.\/-]+)\t([\d\.\/-]+)\t([frl]+)$/)
          d = Datum.new
          d.share = share
          d.goal  = goal
          d.run   = run
          d.time  = Float($1) rescue -1
          d.score = Float($2) rescue -1
          d.path  = $3
          d
        end
      end.compact
    end
  end.compact.flatten
end
test ingest – works – 512783 data points in the directory
<<ingest>>
data = ingest("./raw/15-evo-line/");''
puts data.size
- serialize – not plausible
tried YAML and sqlite3 and neither worked in a reasonable amount of timecreating a sqlite3 table to hold this info
# create database
db = SQLite3::Database.new('raw.db')

table = "evo_eight"

# create table
db.execute("create table #{table} (share INT, goal INT, run INT, time FLOAT, score FLOAT, path STRING);")

# define keys
keys = %w{share goal run time score path}

# create a large insert statement for 1000 data points
stmt = data.map{ |d| "insert into #{table} (#{keys.join(", ")}) values (#{keys[0..-2].map{|k| d.send(k.intern) }.join(", ")}, '#{d.path}');" }

db.transaction{ |db| db.execute_batch(stmt.join("\n")) }
rpn to alg
evo individuals are check on the (0..9) range inclusive
| 4x51+x33x74+//x9x362/x/-x2/5/-x+*98+x3x-*3++5-3-x3x-*3**4++4- |
operators = %W{+ - / *}
$stack = []
ind[0][0].split(//).each do |ch|
  if operators.include?(ch)
    right = $stack.pop or "1"
    left = $stack.pop or "1"
    $stack.push("(#{left} #{ch} #{right})")
  else
    $stack.push(ch)
  end
end
puts $stack.pop
(((x * (((3 - ((6 / 2) / x)) - ((x / 2) / 5)) + x)) + ((((((9 + 8) + ((x * (3 - x)) + 3)) - 5) - 3) * ((x * (3 - x)) * 3)) + 4)) - 4)
set xrange[0:10]
set xtics 0,1,10
set yrange[-120:120]
set grid
plot 100 * sin(x), (((((((((2 * x) - 5) * (3 * ((((((x / ((x / ((2 * x) - 5)) * ((5 * x) / 5))) * x) * 6) - 3) * (x - (5 / 5))) / 5))) / 6) + 3) * x) / 6) + (((3 - x) * x) * 5)) * 8)
wider range
set grid
plot 100 * sin(x), ((((7 * (5 * ((((7 / x) - 3) + x) / (3 - x)))) / x) + x) * x)
- rpn-to-alg in clojure
mainly for clojure practice, lets re-write the above
(def operators '(\+ \- \* \/))
(def string "37x*x9x/3*9-*6-x-x/x+*")
(defn to-alg [chars stack]
  (if (> (.size chars) 0)
    (let [el (first chars)]
      (if (some #{el} operators)
        (to-alg (rest chars)
                (cons
                 (apply str "( " (or (first stack) 1) " " el " " (or (second stack) 1) " )")
                 (rest (rest stack))))
        (to-alg (rest chars) (cons el stack))))
    (first stack)))
(to-alg (seq string) '())
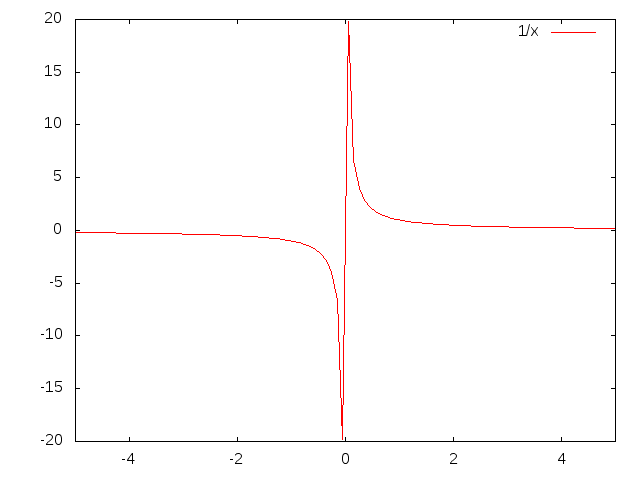
- gnuplot divide by zero
set xrange [-5:5]
plot 1/x
resulting in
narrow down to a specific goal
by_goal = data.select{|d| d.goal == 0}; by_goal.size
clear out early individuals
need to clear out individuals from previous runs – namely those returned before the reset packet
# make sure to remove individuals from before reset packet
temp_by_goal = by_goal.reject{|d| d.time < 2};
ave_max_runtimes
ave_max_time = {}
[1000, 10000, 100000].each do |share|
  data_s = temp_by_goal.select{|d| d.share == share}
  ave_max_time[share] = (0..9).map{|r| data_s.select{|d| d.run == r }.
    sort_by{|d| d.time}.last.time}.inject(0){|a,t| a += t} / 10
end
ave_best_score – for evo
ave_best_score = {}
[100, 1000, 10000].each do |share|
  data_s = temp_by_goal.select{|d| d.share == share}
  ave_best_score[share] = (0..9).map{|r| data_s.select{|d| d.run == r }.
    sort_by{|d| d.score}.first.score}.inject(0){|a,t| a += t} / 10
end
ave_best_score – for coevo
be careful about negative scores
ave_best_score = {}
[1000, 10000, 100000].each do |share|
  data_s = temp_by_goal.select{|d| d.share == share}
  ave_best_score[share] = (0..9).map{|r| data_s.select{|d| d.run == r }.
    select{|d| d.score >= 0}.
    sort_by{|d| d.score}.first.score}.inject(0){|a,t| a += t} / 10
end
best_inds
best_inds = {}
[100, 1000, 10000].each do |share|
  data_s = temp_by_goal.select{|d| d.share == share}
  best_inds[share] = (0..9).map{|run| data_s.sort_by{|d| d.score}.first}.
    sort_by{|d| d.score}.first
end
graph of the fitness of a run
file.open('/tmp/goal_0_coevo.txt', 'w'){|f| f << by_goal.select{|d| d.share == 1000}.select{|d| d.run == 4}.sort_by{|d| d.time}.map{|d| "#{d.time}\t#{d.score}" }.join("\n") }
plot '/tmp/goal_0_coevo.txt' using 1:2
visualize
visualize – dump a set of data to a series of png images in a directory
require 'src/group.rb'
def visualize(data, share, goal, run)
  path = File.join(Dir.pwd, "./videos/#{share}_#{goal}_#{run}/")

  # initialize the group
  g = Group.new(path)

  # pare down the data
  my_data = data.select{|d| (d.run == run) && (d.goal == goal) && (d.share == share)}

  # make the graphs
  timer = 0
  my_data.sort_by{|d| d.time}.each do |d|
    g.update("c#{d.score} #{d.path}")
    # if d.time.floor > timer
    #   timer = d.time.floor
    #   g.plot(timer)
    # end
    if d.time < 20
      timer += 1
      g.plot(sprintf("%04d", timer))
    end
  end
  timer
end
visualize(temp_by_group, 1000, 0, 4)
conversion into a movie
- with instructions from http://electron.mit.edu/~gsteele/ffmpeg/
-
done with ffmpeg
ffmpeg -r 4 -i %04d.png ./evo_eight_100_2_1.mp4
-
conversion to mpg done with mencoder, for example…
mencoder coevo_line_10000_2_1.mp4 -ovc lavc -vf scale=352:288 -oac lavc -o coevo_line_10000_2_1.mpg
comparisons
sharing rates
- evo-eight
- Goal 0
-
runtime – all completed inside of 10 seconds
irb(main):176:0> ave_max_time ave_max_time {10000=>3.6102906, 100=>6.4068757, 1000=>2.8806907} -
score – average best score, I believe this is misleading however as
some of the 0s were not recorded for being received too early
irb(main):185:0> ave_best_score ave_best_score {10000=>3192.3, 100=>0.0, 1000=>3157.8} -
percent fully completed – again I believe these should all be 10/10
but are different due to recording errors. Strong evidence in favor
of this is the fact that recording terminated which only occurs
after receiving a fully successful individual.
- s = 100 completed 10/10
- s = 1000 completed 8/10
- s = 10000 completed 8/10
-
runtime – all completed inside of 10 seconds
- Goal 1
-
runtime – all completed inside of 10 minutes
irb(main):204:0> ave_max_time ave_max_time {10000=>24.0118271, 100=>1.9693912, 1000=>3.1030883} -
score – all run completed so all reached best possible score
irb(main):212:0> ave_best_score ave_best_score {10000=>0.0, 100=>0.0, 1000=>0.0} -
example individual
4827-*/*/7xxx**+
-
runtime – all completed inside of 10 minutes
- Goal 2
-
runtime – no runs completed
irb(main):052:0> ave_max_time ave_max_time {10000=>1207.943955, 100=>1207.720609, 1000=>1210.959188} -
score – looks like two actually succeeded…
irb(main):096:0> ave_best_score ave_best_score {10000=>255.311111111111, 100=>253.433333333333, 1000=>183.966666666667} -
best individual at 100 sharing with
- score – 1206.406949
-
rep –
((((7 * (5 * ((((7 / x) - 3) + x) / (3 - x)))) / x) + x) * x) -
graph –

-
runtime – no runs completed
- Goal 0
- evo-line
- Goal 0
- Goal 1
- Goal 2
- Goal 0
- coevo-eight
- Goal 0
-
run-time – looks like most aren't finishing
irb(main):298:0> ave_max_time ave_max_time {10000=>1207.0363047, 100000=>1206.9868935, 1000=>1207.0620207} -
score – average best seems to indicate faster sharing is better
irb(main):322:0> ave_best_score ave_best_score {10000=>16.624, 100000=>89985.059, 1000=>5986.421} -
success rate – looks like some did succeed
irb(main):339:0> best_scores[1000]
best_scores[1000]
[1.0, 1.0, 7.0, 9.0, 0.0, 0.0, 7.0, 6.0, 59826.21, 7.0]
- individual
-
run-time – looks like most aren't finishing
- Goal 0
Date: 2010-01-10 16:59:59 MST
HTML generated by org-mode 6.33trans in emacs 23