« Data Analysis and Models for Complex Systems (CSCI 7000) | Main | Steve Jobs »
September 09, 2011
What is the probability of a 9/11-size terrorist attack?
Sunday is the 10-year anniversary of the 9/11 terrorist attacks. As a commemoration of the day, I'm going to investigate answers to a very simple question: what is the probability of a 9/11-size or larger terrorist attack?
There are many ways we could try to answer this question. Most of them don't involve using data, math and computers (my favorite tools), so we will ignore those. Even using quantitative tools, approaches differ based on how strong are the assumptions they make about the social and political processes that generate terrorist attacks. We'll come back to this point throughout the analysis.
Before doing anything new, it's worth repeating something old. For the better part of the past 8 years that I've been studying the large-scale patterns and dynamics of global terrorism (see for instance, here and here), I've emphasized the importance of taking an objective approach to the topic. Terrorist attacks may seem inherently random or capricious or even strategic, but the empirical evidence demonstrates that there are patterns and that these patterns can be understood scientifically. Earthquakes and seismology serves as an illustrative example. Earthquakes are extremely difficult to predict, that is, to say beforehand when, where and how big they will be. And yet, plate tectonics and geophysics tells us a great deal about where and why they happen and the famous Gutenberg-Richter law tells us roughly how often quakes of different sizes occur. That is, we're quite good at estimating the long-time frequencies of earthquakes because larger scales allows us to leverage a lot of empirical and geological data. The cost is that we lose the ability to make specific statements about individual earthquakes, but the advantage is insight into the fundamental patterns and processes.
The same can be done for terrorism. There's now a rich and extensive modern record of terrorist attacks worldwide [1], and there's no reason we can't mine this data for interesting observations about global patterns in the frequencies and severities of terrorist attacks. This is where I started back in 2003 and 2004, when Maxwell Young and I started digging around in global terrorism data. Catastrophic events like 9/11, which (officially) killed 2749 people in New York City, might seem so utterly unique that they must be one-off events. In their particulars, this is almost surely true. But, when we look at how often events of different sizes (number of fatalities) occur in the historical record of 13,407 deadly events worldwide [2], we see something remarkable: their relative frequencies follow a very simple pattern.

The figure shows the fraction of events that killed at least x individuals, where I've divided them into "severe" attacks (10 or more fatalities) and "normal" attacks (less than 10 fatalities). The lions share (92.4%) of these events are of the "normal" type, killing less than 10 individuals, but 7.6% are "severe", killing 10 or more. Long-time readers have likely heard this story before and know where it's going. The solid line on the figure shows the best-fitting power-law distribution for these data [3]. What's remarkable is that 9/11 is very close to the curve, suggesting that statistically speaking, it is not an outlier at all.
A first estimate: In 2009, the Department of Defense received the results of a commissioned report on "rare events", with a particular emphasis on large terrorist attacks. In section 3, the report walks us through a simple calculation of the probability of a 9/11-sized attack or larger, based on my power-law model. It concludes that there was a 23% chance of an event that killed 2749 or more between 1968 and 2006. [4] The most notable thing about this calculation is that its magnitude makes it clear that 9/11 should not be considered a statistical outlier on the basis of its severity.
How we can we do better: Although probably in the right ballpark, the DoD estimate makes several strong assumptions. First, it assumes that the power-law model holds over the entire range of severities (that is x>0). Second, it assumes that the model I published in 2005 is perfectly accurate, meaning both the parameter estimates and the functional form. Third, it assumes that events are generated independently by a stationary process, meaning that the production rate of events over time has not changed nor has the underlying social or political processes that determine the frequency or severity of events. We can improve our estimates by improving on these assumptions.
A second estimate: The first assumption is the easiest to fix. Empirically, 7.6% of events are "severe", killing at least 10 people. But, the power-law model assumed by the DoD report predicts that only 4.2% of events are severe. This means that the DoD model is underestimating the probability of a 9/11-sized event, that is, the 23% estimate is too low. We can correct this difference by using a piecewise model: with probability 0.076 we generate a "severe" event whose size is given by a power-law that starts at x=10; otherwise we generate a "normal" event by choosing a severity from the empirical distribution for 0 < x < 10 . [5] Walking through the same calculations as before, this yields an improved estimate of a 32.6% chance of a 9/11-sized or larger event between 1968-2008.
A third estimate: The second assumption is also not hard to improve on. Because our power-law model is estimated from finite empirical data, we cannot know the alpha parameter perfectly. Our uncertainty in alpha should propagate through to our estimate of the probability of catastrophic events. A simple way to capture this uncertainty is to use a computational bootstrap resampling procedure to generate many synthetic data sets like our empirical one. Estimating the alpha parameter for each of these yields an ensemble of models that represents our uncertainty in the model specification that comes from the empirical data.
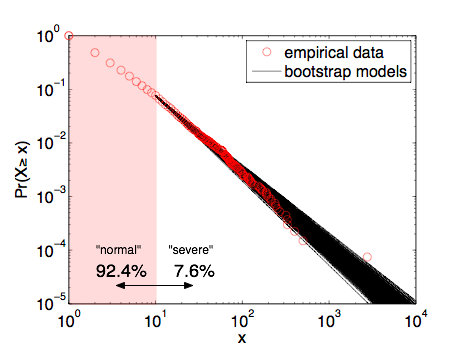
This figure overlays 1000 of these bootstrap models, showing that they do make slightly different estimates of the probability of 9/11-sized events or larger. As a sanity check, we find that the mean of these bootstrap parameters is alpha=2.397 with a standard deviation of 0.043 (quite close to the 2.4+/-0.1 value I published in 2009 [6]). Continuing with the simulation approach, we can numerically estimate the probability of a 9/11-sized or larger event by drawing synthetic data sets from the models in the ensemble and then asking what fraction of those events are 9/11-sized or larger. Using 10,000 repetitions yields an improved estimate of 40.3%.
Some perspective: Having now gone through three calculations, it's notable that the probability of a 9/11-sized or larger event has almost doubled as we've improved our estimates. There are still additional improvements we could do, however, and these might push the number back down. For instance, although the power-law model is a statistically plausible model of the frequency-severity data, it's not the only such model. Alternatives like the stretched exponential or the log-normal decay faster than the power law, and if we were to add them to the ensemble of models in our simulation, they would likely yield 9/11-sized or larger events with lower frequencies and thus likely pull the probability estimate down somewhat. [7]
Peering into the future: Showing that catastrophic terrorist attacks like 9/11 are not in fact statistical outliers given the sheer magnitude and diversity of terrorist attacks worldwide over the past 40 years is all well and good, you say. But, what about the future? In principle, these same models could be easily used to make such an estimate. The critical piece of information for doing so, however, is a clear estimate of the trend in the number of events each year. The larger that number, the greater the risk under these models of severe events. That is, under a fixed model like this, the probability of catastrophic events is directly related to the overall level of terrorism worldwide. Let's look at the data.
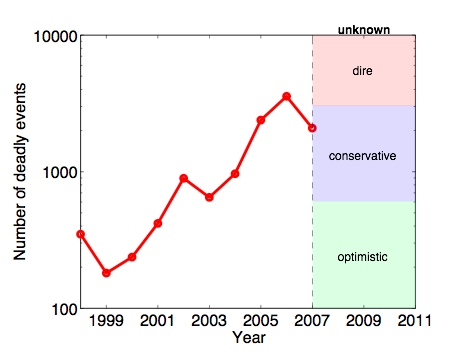
Do you see a trend here? It's difficult to say, especially with the changing nature of the conflicts in Iraq and Afghanistan, where many of the terrorist attacks of the past 8 years have been concentrated. It seems unlikely, however, that we will return to the 2001 levels (200-400 events per year; the optimist's scenario). A dire forecast would have the level continue to increase toward a scary 10,000 events per year. A more conservative forecast, however, would have the rate continue as-is relative to 2007 (the last full year for which I have data), or maybe even decrease to roughly 1000 events per year. Using our estimates from above, 1000 events overall would generate about 75 "severe" events (more than 10 fatalities) per year. Plugging this number into our computational model above (third estimate approach), we get an estimate of roughly a 3% chance of a 9/11-sized or larger attack each year, or about a 30% chance over the next decade. Not a certainty by any means, but significantly greater than is comfortable. Notably, this probability is in the same ballpark for our estimates for the past 40 years, which goes to show that the overall level of terrorism worldwide has increased dramatically during those decades.
It bears repeating that this forecast is only as good as the models on which it is based, and there are many things we still don't know about the underlying social and political processes that generate events at the global scale. (In contrast to the models the National Hurricane Center uses to make hurricane track forecasts.) Our estimates for terrorism all assume a homogeneous and stationary process where event severities are independent random variables, but we would be foolish to believe that these assumptions are true in the strong sense. Technology, culture, international relations, democratic movements, urban planning, national security, etc. are all poorly understood and highly non-stationary processes that could change the underlying dynamics in the future, making our historical models less reliable than we would like. So, take these estimates for what they are, calculations and computations using reasonable but potentially wrong assumptions based on the best historical data and statistical models currently available. In that sense, it's remarkable that these models do as well as they do in making fairly accurate long-term probabilistic estimates, and it seems entirely reasonable to believe that better estimates can be had with better, more detailed models and data.
Update 9 Sept. 2011: In related news, there's a piece in the Boston Globe (free registration required) about the impact 9/11 had on what questions scientists investigate that discusses some of my work.
-----
[1] Estimates differ between databases, but the number of domestic or international terrorist attacks worldwide between 1968 and 2011 is somewhere in the vicinity of 50,000-100,000.
[2] The historical record here is my copy of the National Memorial Institute for the Prevention of Terrorism (MIPT) Terrorism Knowledge Base, which stores detailed information on 36,018 terrorist attacks worldwide from 1968 to 2008. Sadly, the Department of Homeland Security pulled the plug on the MIPT data collection effort a few years ago. The best remaining data collection effort is the one run by the University of Maryland's National Consortium for the Study of Terrorism and Response to Terrorism (START) program.
[3] For newer readers: a power-law distribution is a funny kind of probability distribution function. Power laws pop up all over the place in complex social and biological systems. If you'd like an example of how weird power-law distributed quantities can be, I highly recommend Clive Crook's 2006 piece in The Atlantic title "The Height of Inequality" in which he considers what the world would look like if human height were distributed as unequally as human wealth (a quantity that is very roughly power-law-like).
[4] If you're curious, here's how they did it. First, they took the power-law model and the parameter value I estimated (alpha=2.38) and computed the model's complementary cumulative distribution function. The "ccdf" tells you the probability of observing an event at least as large as x, for any choice of x. Plugging in x=2749 yields p=0.0000282. This gives the probability of any single event being 9/11-sized or larger. The report was using an older, smaller data set with N=9101 deadly events worldwide. The expected number of these events 9/11-sized or larger is then p*N=0.257. Finally, if events are independent then the probability that we observe at least one event 9/11-sized or larger in N trials is 1-exp(-p*N)=0.226. Thus, about a 23% chance.
[5] This changes the calculations only slightly. Using alpha=2.4 (the estimate I published in 2009), given that a "severe" event happens, the probability that it is at least as large as 9/11 is p=0.00038473 and there were only N=1024 of them from 1968-2008. Note that the probability is about a factor of 10 larger than the DoD estimate while the number of "severe" events is about a factor of 10 smaller, which implies that we should get a probability estimate close to theirs.
[6] In "Power-law distributions in empirical data," SIAM Review 51(4), 661-703 (2009), with Cosma Shalizi and Mark Newman.
[7] This improvement is mildly non-trivial, so perhaps too much effort for an already long-winded blog entry.
posted September 9, 2011 02:17 PM in Terrorism | permalink
Comments
Unexpectedly got stuck on your interesting calculations. But I have to think this over indeed.
I do agree that 9/11 is one-off like event. And following your estimates we must got 9/11-like event at least several times during last years, right?
Who knows, maybe we did get very high chances but FBI-like services saved thousands lifes
.
Anyway great job. Gonna discuss all this with my friends.
Posted by: Astrologicheskij Prognoz at September 11, 2011 08:17 AM